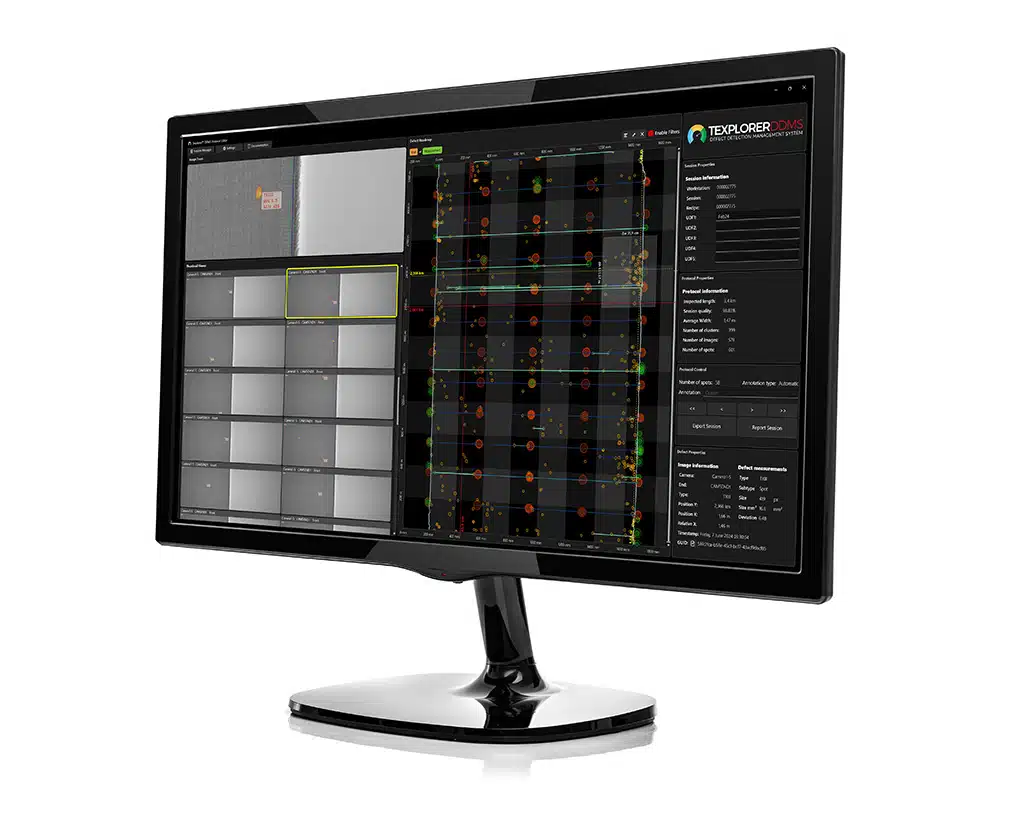
Texplorer™ DDMS provides three management applications in one single powerful and responsive environment. Texplorer™ DDMS Protocol Editor for offline editing protocols and preparing cut plans, Texplorer™ DDMS Live Viewer for real time displaying and visualization of defects and running quality during inspection, and Texplorer™ DDMS Protocol Viewer that provides a visual representation of the cut plan and the defect protocol during the cutting proces.

Texplorer™ DDMS
Texplorer™ DDMS Protocol Editor
Session Manager
The session manager shows all roll protocols from all connected VIU™ or Profiler™ inspection systems in your plant. Sort on date, length, quality, session, recipe, or user defined fields (like piece numbers, batch numbers, production numbers, etc.) Use Quick Search by searching on unique roll identification, such as piece numbers, batch numbers, production numbers or recipes. Preconfigure a filter to sort out inspection sessions, low quality rolls or protocols that have already been reviewed by an operator and keep your session manager organized.
Defect clusters, annotations & classification
Individual defects are automatically grouped using intuitive, customizable filters and defect conditions defined by the customer. These grouped defects, known as clusters, are automatically graded according to their severity. Both clusters and individual defects are annotated, typically based on the customer’s defect classification names.Defect road map
The defect road map is a responsive representation of all individual as well as grouped defects (clusters) in the roll. Individual defects are indicated with circles, clusters with rectangles. The positions of the material edges are accurately plotted. A range of intuitive tools makes even large roles easy to quickly analyze.
Zoom & Image Viewer
The Zoom tool automatically zooms in on the defect’s location in the high-resolution image, displaying the defect without the overlay information. The image viewer provides a list of all selected defects or clusters.
Defect & Protocol information
The defect and protocol panels provide both individual defect information as well as protocol data, including defect X/Y positions, size, timestamp, severity, class, total number of defects, clusters, etc.
